In InRiver iPMC, every extension to the platform (e.g. a server extension, an entity listener, an inbound connector or something else), will be created and executed with a logging helper class.
This is of course made so we, the developers, can log good things (e.g. statistics or informational events) and bad things (warnings and errors) happening while our extensions execute on the platform.
In this post, I show how to use Microsoft Azure’s Application Insight platform for first-class logging. It goes to continue my series of sample extensions.
What is the issue with the built-in logging service?
From my experience with the InRiver iPMC, I find the built-in logging service fine for a lot of cases. However, it is not that easy to use for performance analytics, monitoring or error alerting.
Say for instance, my extension loads a million entities into the platform in a single execution, or a lot of extensions run. This would make the logging service slow when browsing or searching the log entries from the iPMC Control Center.
Besides, the interface gives you a chronological list of log entries, from the system and from our own code. If you know what to look for, this will often be fine. But for requirements like the following, I would prefer something more:
- Dashboard overview of the code performance.
- Visualization of performance and error trends.
- Monitoring and alert notifications.
A supplementary logging solution in the cloud
Since all InRiver extensions are built on .Net, we can integrate with the Application Insights platform from Microsoft Azure.
It has a lot of cool features, mainly used for websites and mobile apps, however also very useful for desktop apps and serverless functions (like InRiver extensions). Read about it here.
I do not advice or recommend you to stop using the built-in logging system. Application Insights should only be seen as a supplementary logging platform within reach and ownership of the implementation partner and/or the platform customer.
If an extension omits logging events to the built-in logging service, InRiver support engineers would not have a chance helping you, if that extension stops working.
The solution
Applying Application Insights to an ASP.Net solution is very easy. But for a non-web solution it took a little time to figure out and implement. It took some tweaking to implement correlation of log entries, so they all appear grouped per execution of the extension methods.
In my demo solution (available at GitHub), I created two wrapper classes around the TelemetryClient and other classes. This makes it easy to:
- Set up the buffered telemetry client.
- Write events, exceptions and metrics.
- Flush the buffered data before exiting the InRiver extension.
The wrapper classes can be used like in the following examples.
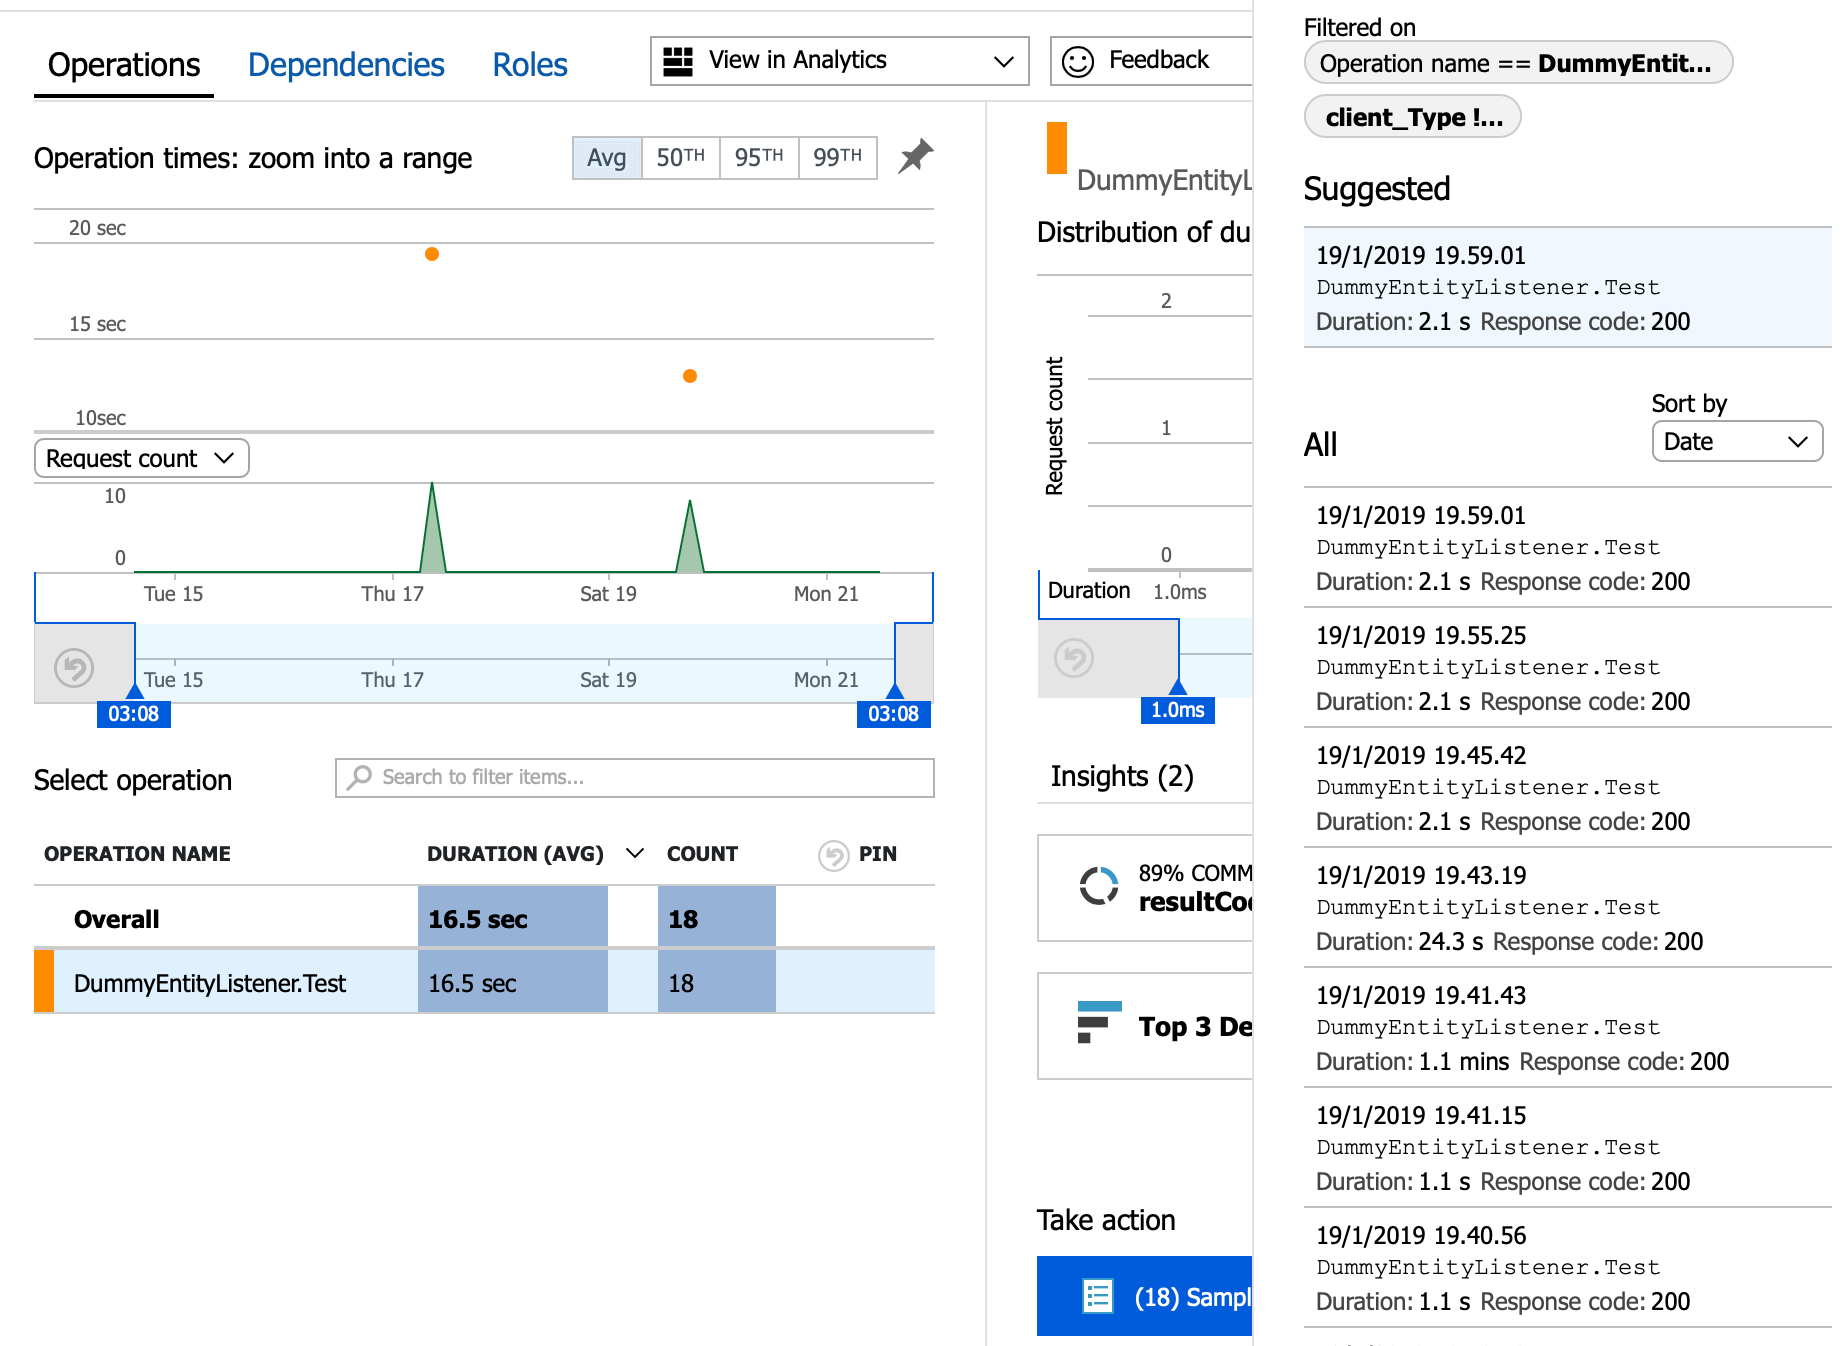
Here is a screenshot of the performance overview, in this case having only a single extension with only a single method being called. In the right-hand panel, you see some of the executions of the selected parent operation.
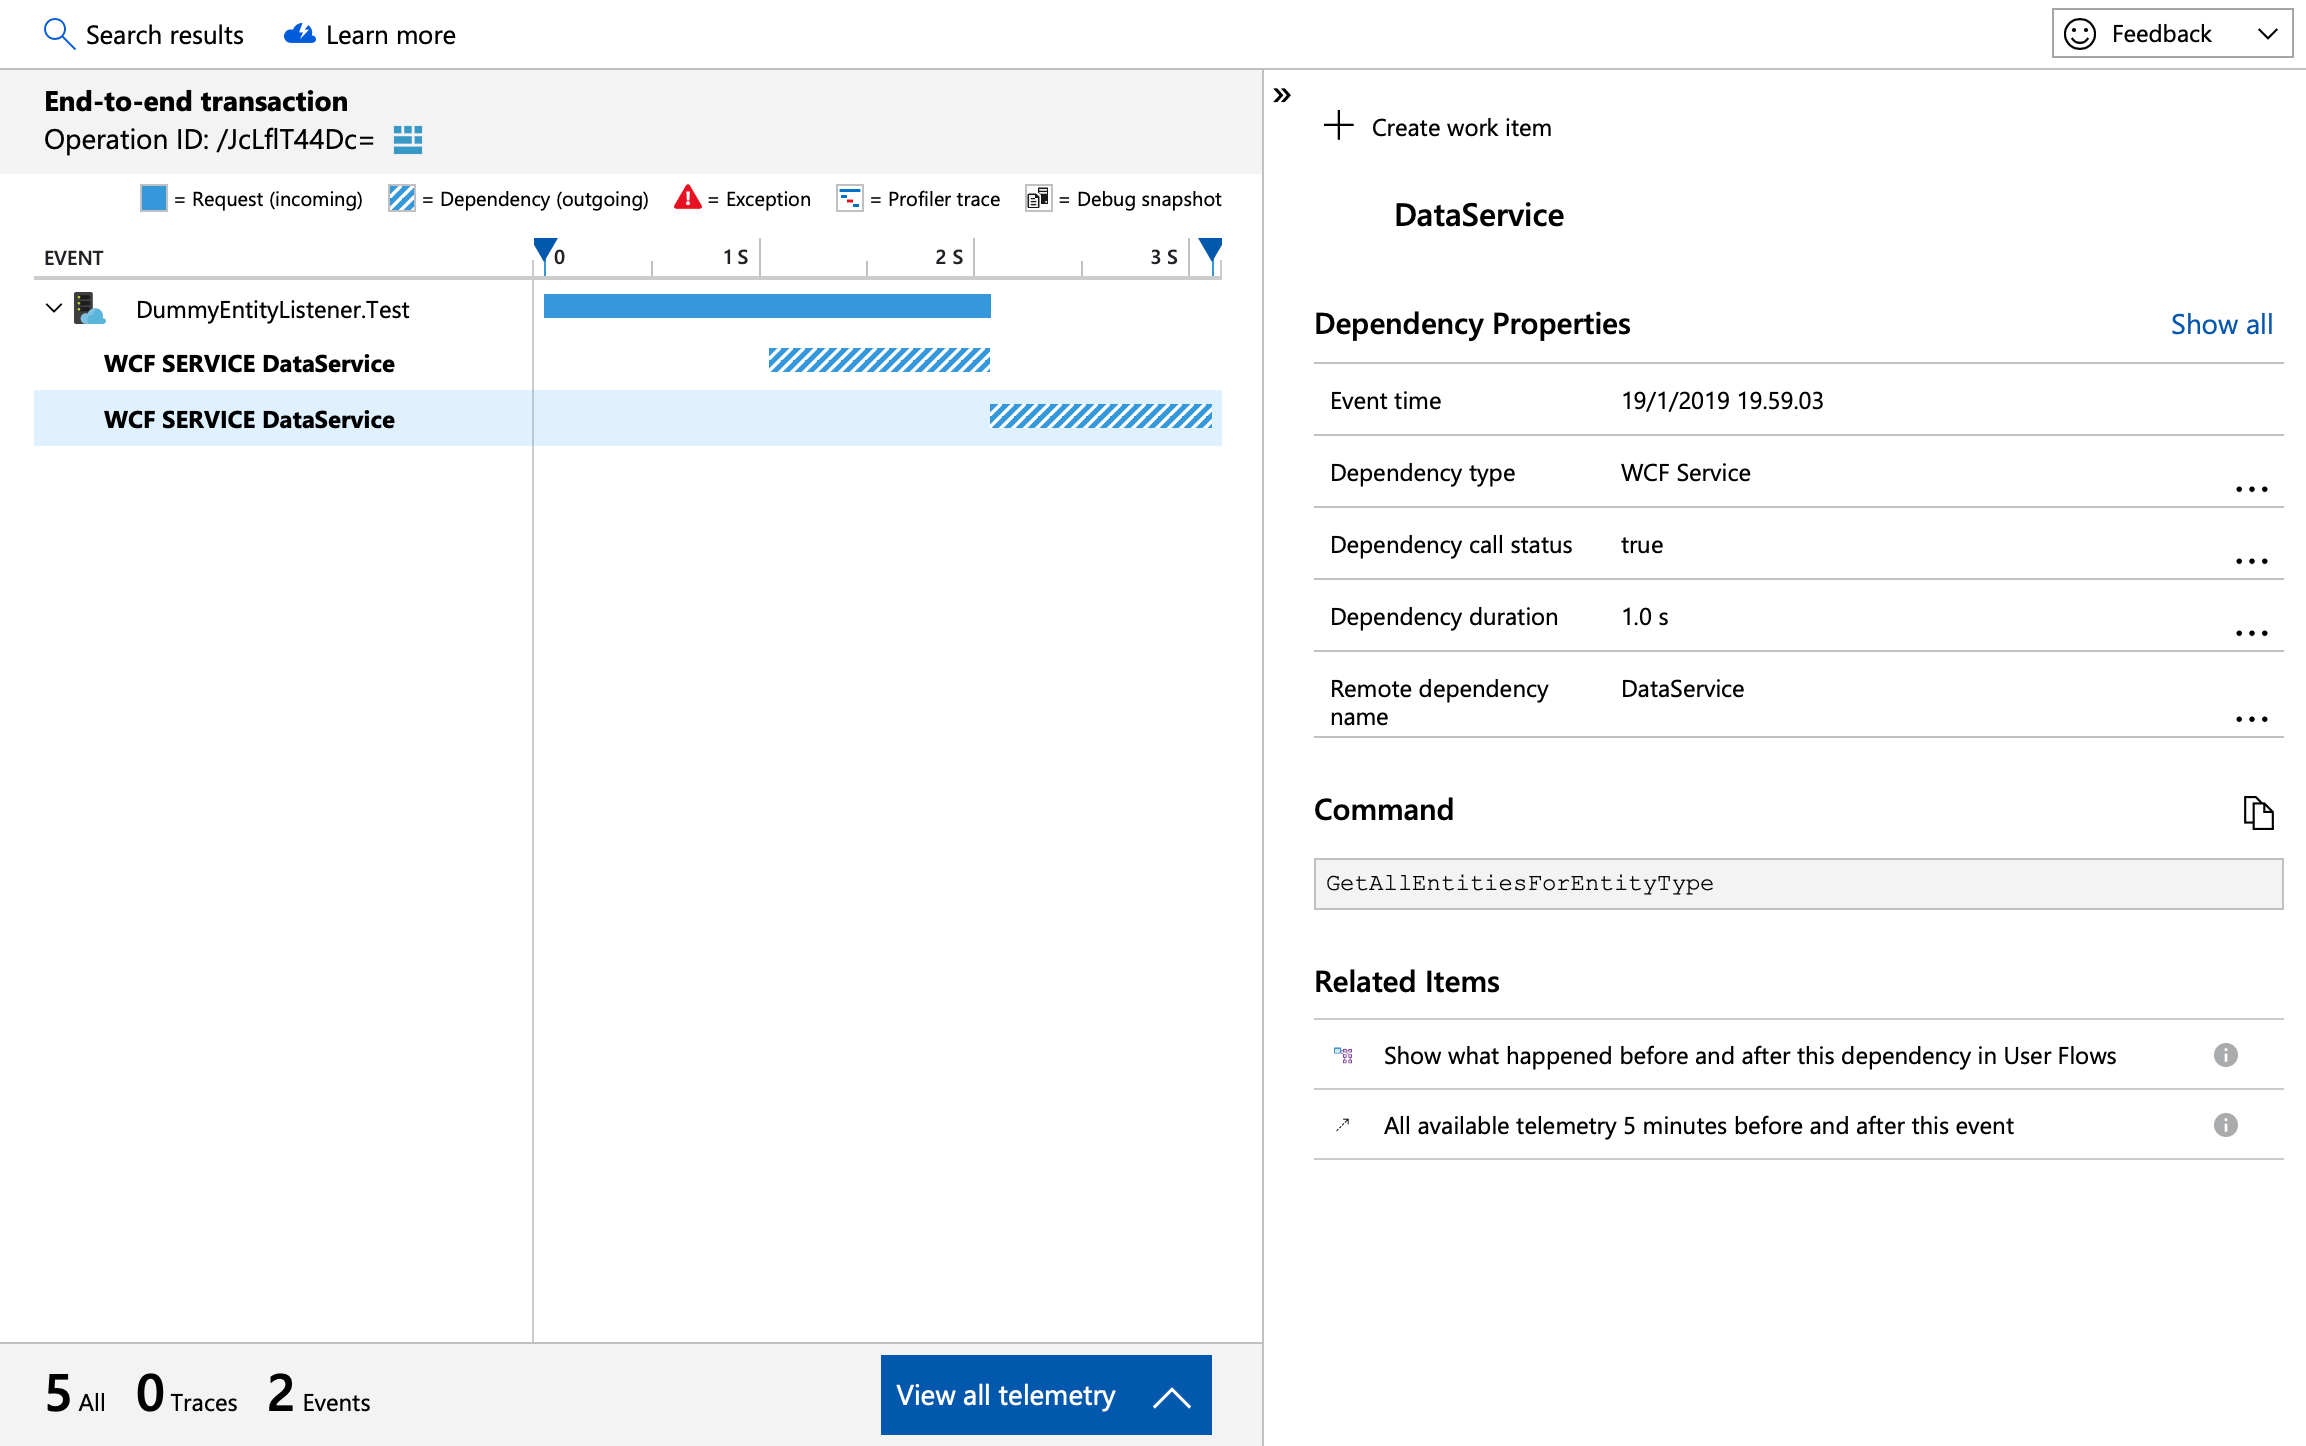
In this next screenshot, a single execution is selected. The window displays a timeline of the parent operation, with all individual events, tracked dependencies (API calls etc.) and exceptions.
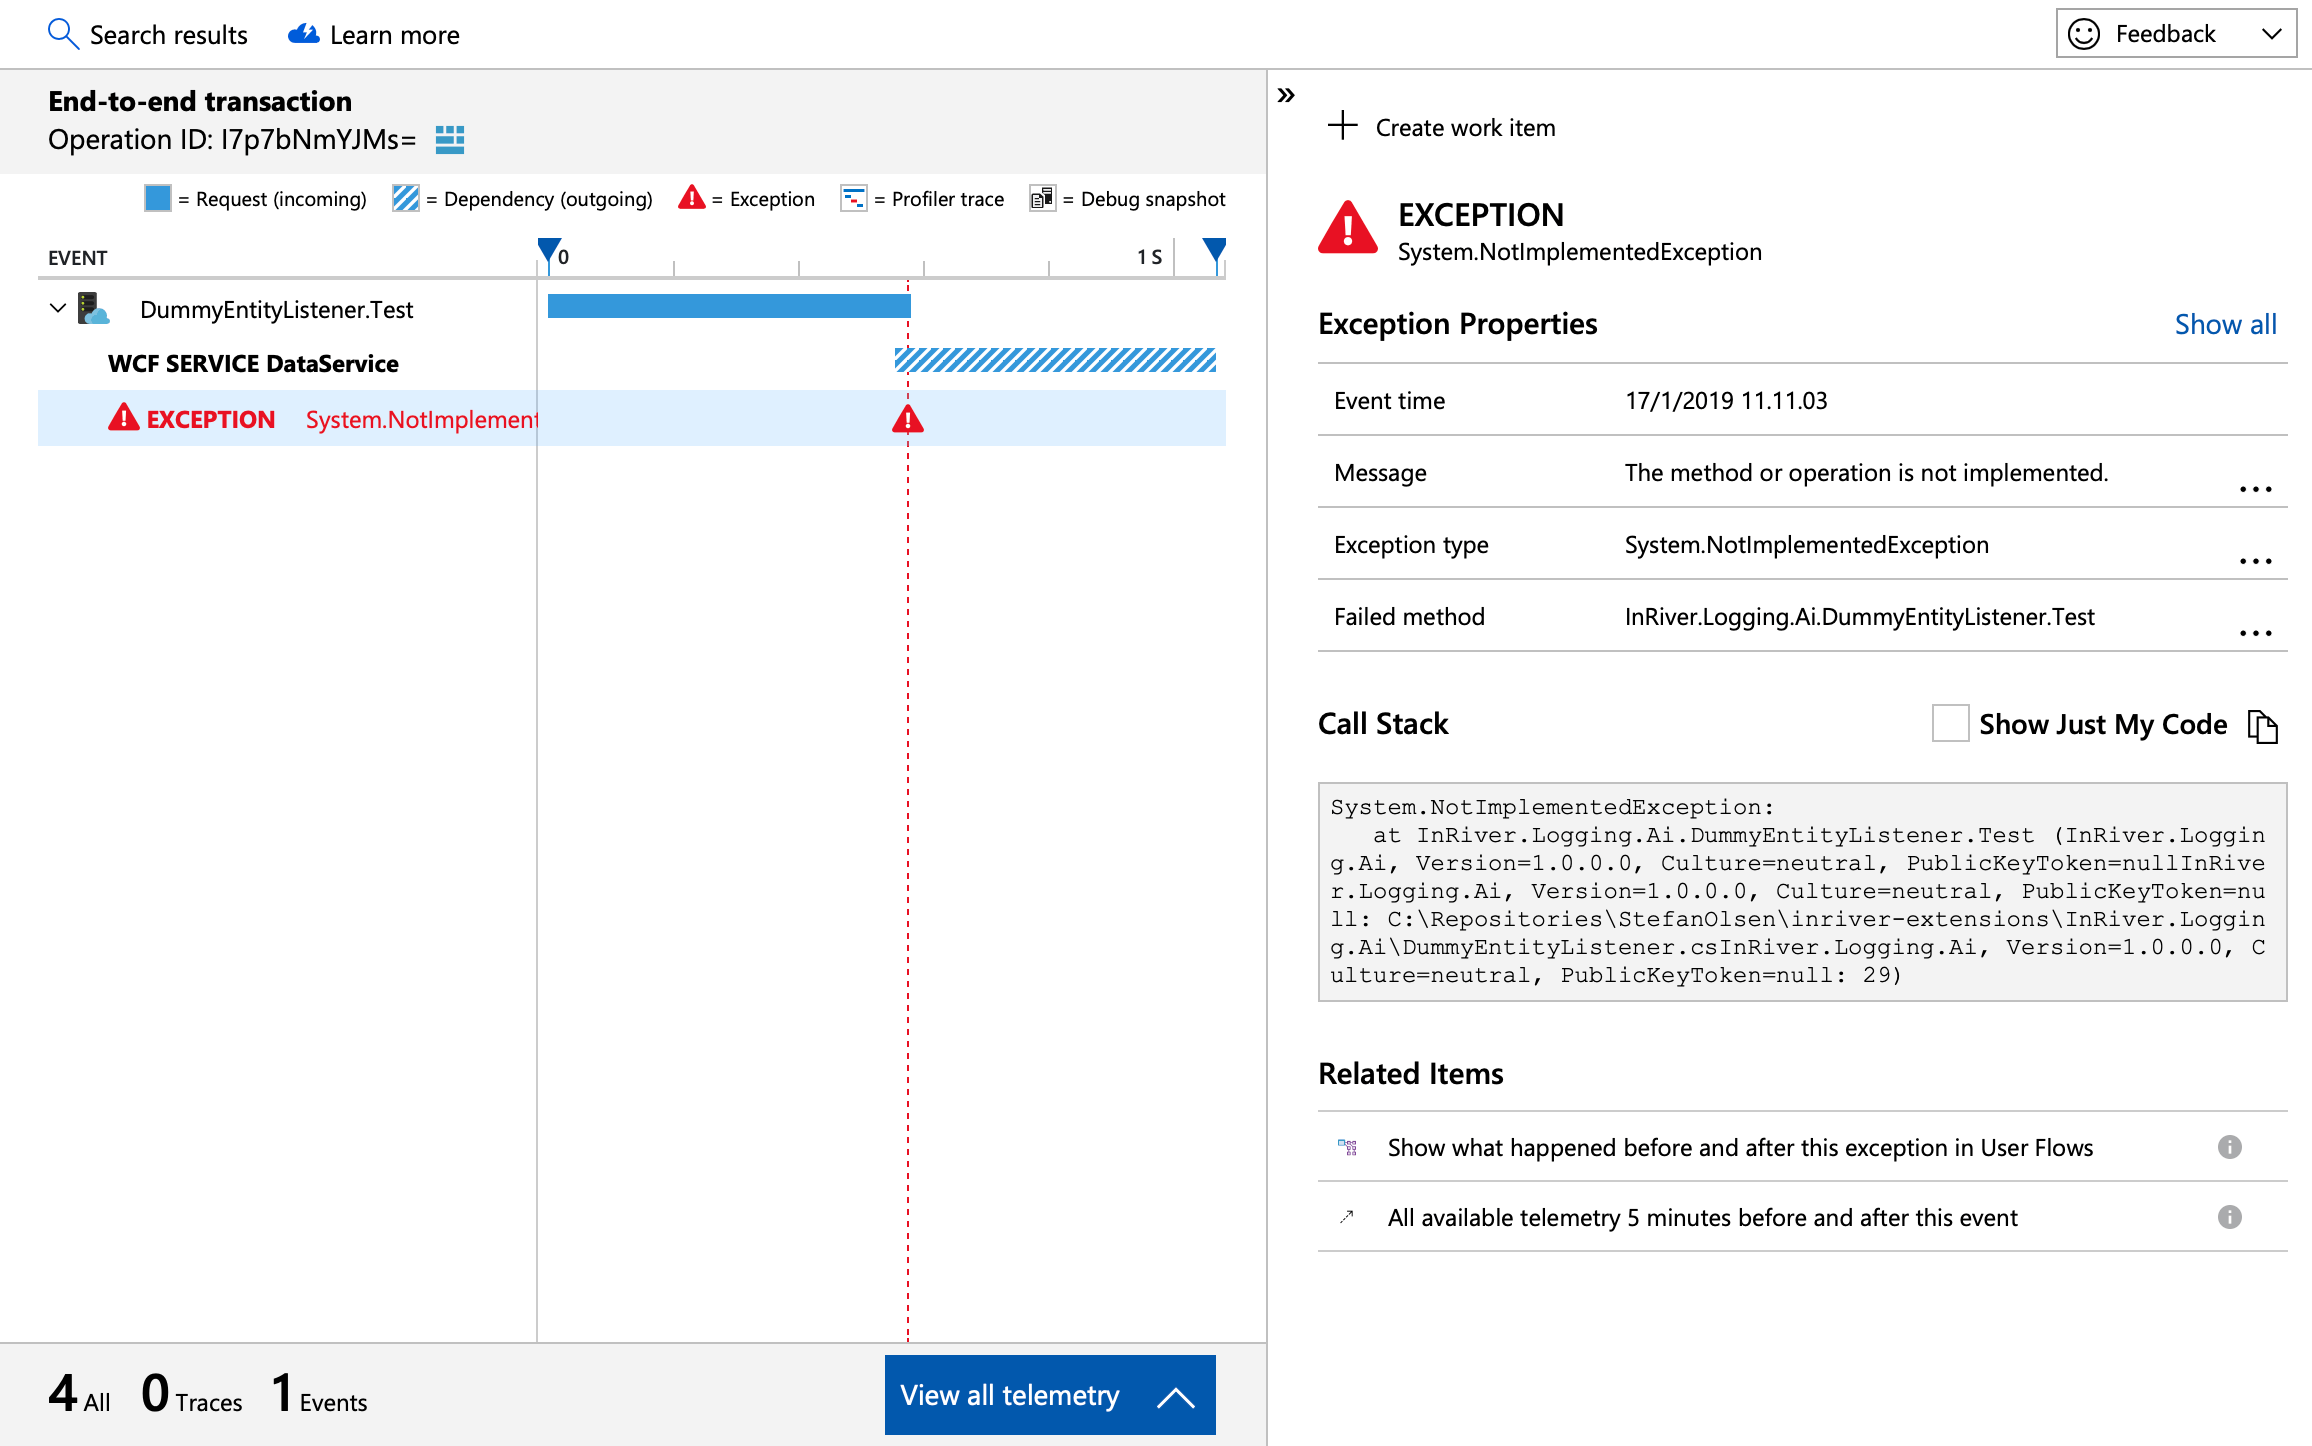
The last screenshot shows the level of details you get from a logged exception. In this case, a simulated exception was caught by a catch-block in the extension class method (catching unhandled exceptions).