By default, most web servers are logging all incoming web requests to a folder or a log system. This includes URL and response code. For someone to read and handle those failed requests a user friendly report interface would probably be appreciated. Something with URL, response code and frequency count.
In this blog post, we will see how to easily query a list of failed requests. I will fetch data from Azure Application Insights, using their query API.
Usual approach to logging failed requests
In many Episerver sites add-ons, like BVN404, are added to log "404 requests", or ELMAH to log uncaught exceptions and their request URLs.
Both are tools that perform a single task with a simple user interface. They both run on the same servers and databases as the website itself. This can all be very good, especially if you do not have a central log solution in place.
But if you already have a fully featured log collection and analysis tool, why not use it for reporting failed requests too?
Take advantage of Application Insights
I am a fan of Application Insights, which also shines through in my last blog post about logging metrics and metadata.
Sites that are hosted in Episerver DXC get Application Insights out-of-the-box. And for sites hosted privately, or in other cloud set-ups, Application Insights is free up to a very high limit (and cheap thereafter).
Besides automatically collecting and indexing logged requests, exceptions and traces, the tool also features a very powerful analytics engine, which can be exploited for the listings I want to extract.
A fast log query
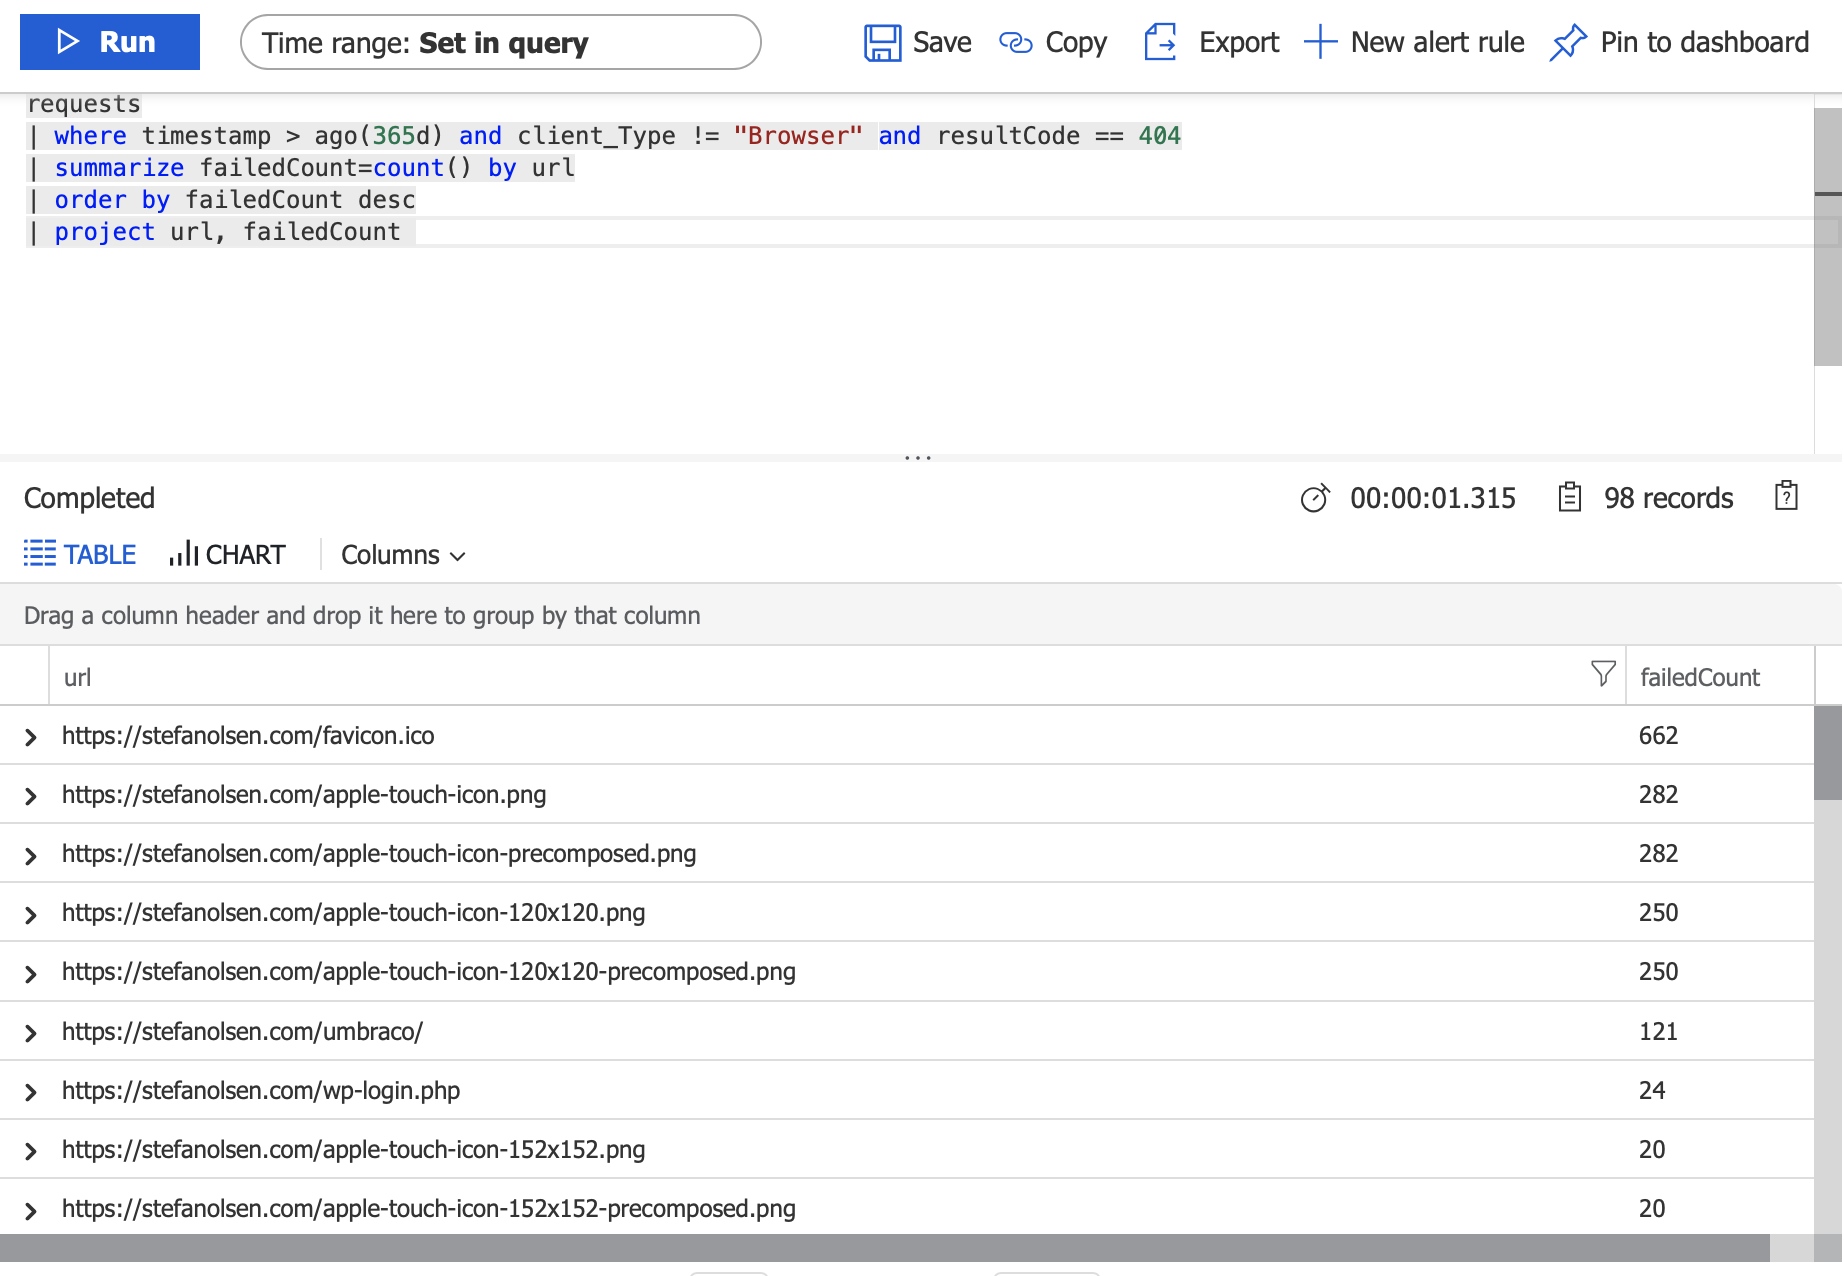
To produce a summarized list of requests failing for different reasons, I created the following log analytics query. It is very fast and simple.
requests
| where timestamp > ago(365d) and client_Type != "Browser" and resultCode == 404
| summarize failedCount=count() by url
| order by failedCount desc
| project url, failedCount
The date span (365 days) and the http status code filters are hard coded in the sample, and can be changed or dynamically replaced as needed.
When executing the query in Application Insights’ Log Analytics interface, I get a table like shown in this screenshot.
Querying from a REST client
Executing log queries in the Azure portal can be nice for some people. But it is not very accessible for everybody. Of course, a REST API call is even worse. However, it can be used in some very nice integrations, which I will get back to.
Executing a log query, through the official REST API, is really easy.
- Obtain an API key from the Application Insights instance (in the Azure portal). DXC customers need to request such keys from Episerver Support.
- Invoke the endpoint, passing the log query as a query string.
- Parse the JSON response.
When done with the familiar Postman tool, I get a JSON response looking somewhat like this.
{
    "tables":[{
        "name":"PrimaryResult",
        "columns":[
        {
            "name":"url",
            "type":"string"
        },
        {
            "name":"failedCount",
            "type":"long"
        }],
        "rows":[
            ["https://stefanolsen.com/favicon.ico", 663],
            ["https://stefanolsen.com/apple-touch-icon.png", 282],
            ["https://stefanolsen.com/apple-touch-icon-precomposed.png", 282],
            ["https://stefanolsen.com/apple-touch-icon-120x120-precomposed.png", 250],
            ["https://stefanolsen.com/apple-touch-icon-120x120.png", 250],
            ["https://stefanolsen.com/umbraco/", 121],
            ["https://stefanolsen.com/wp-login.php", 24],
            ["https://stefanolsen.com/apple-touch-icon-152x152-precomposed.png", 20],
            ["https://stefanolsen.com/apple-touch-icon-152x152.png", 20],
            ["https://stefanolsen.com/2/favicon.ico", 19],
            ["https://stefanolsen.com/3/favicon.ico", 18]
        ]
    }]
}
Applying this in other ways
I leave this blog post without complete sample code or installable packages. This is because what I believe may be a nice and usable interface may not work for you and your users.
But here are some ideas that you can go implement:
- Custom report in Episerver.
- Gadget in Episerver.
- Suggestions for URL redirects (like the well-known BVN404 package).
- Dump to a data warehouse and show it in PowerBI.
- Show on a TV dashboard with nice graphs etc.